

Research published in August 2022 by the Food Standards Agency (FSA) provided updated statistics on food allergies, intolerances and other hypersensitivities.
The bi-annual Food and You 2 online survey, conducted by Ipsos, measures self-reported knowledge, attitudes and behaviours related to various issues including food safety and security, sustainability and diets. A total of 5,796 adults from 4,026 households across England, Wales, and Northern Ireland completed the survey between 18 October 2021 and 10 January 2022.
Of particular interest to us were the questions on food allergies, intolerances and other hypersensitivities, along with respondents’ views on eating out and ordering takeaways.
Food allergies and intolerances – key findings
– Just over 1 in 10 (12%) of respondents reported that they had a food intolerance, 4% reported having a food allergy, and 1% reported having coeliac disease
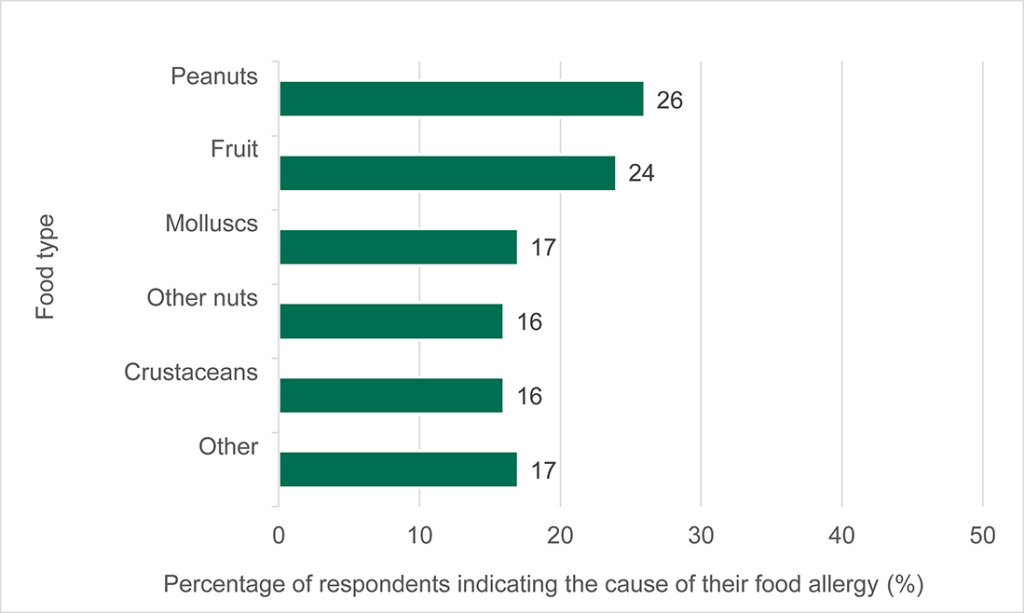
– Of the respondents who reported having a food allergy, the most common foods causing a reaction were peanuts (26%) and fruit (24%), followed by molluscs (17%), other nuts (16%) and crustaceans (16%). In addition, 17% reported an allergy to other various foods not currently classified as one of the 14 allergens.
– Of the respondents who reported having a food intolerance, the most common foods causing a reaction were cow’s milk and products made with cow’s milk (41%) and cereals containing gluten (19%), followed by vegetables (14%), fruit (8%) and various other foods (24%).
Eating out and ordering takeaways – checking allergen information
Respondents who suffer from an unpleasant physical reaction after consuming certain foods were asked how often, if at all, they checked in advance that information was available that would allow them to identify food that might cause a reaction when they ate out or ordered a takeaway from somewhere new.
Around 2 in 10 (21%) respondents always checked in advance that information was available that would allow them to identify food that might cause a bad reaction, and around 4 in 10 (42%) checked that this information was available either most of the time or less often. However, more than a third (37%) of respondents never checked in advance that this information was available.
Eating out and ordering takeaways – obtaining allergen information
Respondents who suffer from an unpleasant physical reaction after consuming certain foods were asked how often information that allowed them to identify food that might cause them a bad reaction was readily available when eating out or buying food.
More than 1 in 10 (13%) respondents reported that this information was always readily available and around two-thirds (68%) reported that this information was available most of the time or less often. However, 9% of respondents reported that this information was never readily available when they ate out or bought food to take away.
Respondents were asked how often they asked a member of staff for more information when it is not readily available. Around 2 in 10 (22%) reported that they always asked staff for more information, whilst 43% did this most of the time or less often, and 32% never asked staff for more information.
Respondents were asked how comfortable they felt asking a member of staff for more information about food that might cause them a bad or unpleasant physical reaction. Around 7 in 10 (72%) reported that they were very or fairly comfortable asking staff for more information. However, 17% of respondents reported that they were not very or not at all comfortable doing this.
Eating out and ordering takeaways – confidence in allergen information
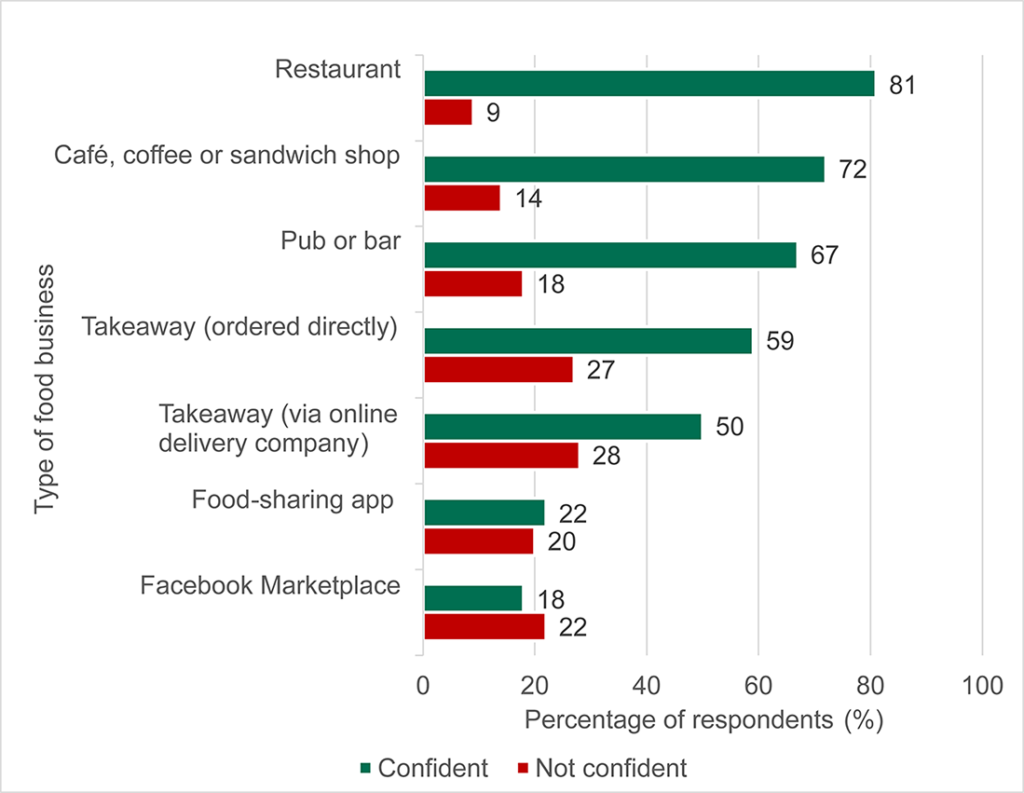
Respondents who had a food hypersensitivity were asked how confident they were that the information provided at different types of food businesses would allow them to identify and avoid food that might cause an unpleasant reaction. Respondents were more likely to report confidence (i.e., very or fairly confident) in the information provided by restaurants (81%), cafés, coffee or sandwich shops (72%), and pubs or bars (67%) compared to the information provided by takeaways when ordering directly from a takeaway shop or restaurant (59%) or when ordering through an online ordering and delivery company (for example, JustEat, Deliveroo, UberEats) (50%). Respondents were least likely to report confidence in the information provided by food-sharing apps (for example, Olio or Too Good To Go) (22%) or Facebook Marketplace (18%).
Most respondents were very or fairly confident that the information provided in writing (83%) or verbally by a member of staff (69%) would allow them to identify and avoid food that might cause an unpleasant reaction.
Would you like to share more information with your customers? Try Menu Guide free for a month and see the difference it makes.
 Our Food – FSA & FSS Annual Review
 Best practice for allergen information
 Allergen information for distance selling
 Draft guidance for allergen information
 Naming vegan alternatives to dairy foods